


Neighbourhoods in the same city can experience different air quality during Diwali. Fireworks where used, traffic, other emissions and weather can affect concentrations that a distant station may not capture. A live sensor map shows what has already been measured, but planning teams may also need to know where concentrations could rise next.
AI-based pollution hotspot prediction combines sensor observations, weather conditions and forecasting models to estimate possible changes at specific locations. An effective Diwali air pollution monitoring platform must first establish whether the incoming measurements are reliable. Only then can it produce forecasts, map areas of concern and send alerts without presenting uncertain estimates as confirmed facts.
Plan the Air Quality Sensor Network Before Diwali
Decide which measurements support the forecast
A network of IoT air quality sensors can collect measurements at selected locations, but the equipment must match the monitoring objective. PM2.5 and PM10 monitoring is particularly relevant when tracking airborne particulate concentrations. Some installations may also include appropriate gas sensors, depending on available equipment and the intended analysis.
Temperature and relative humidity give important context: they can influence sensor response and atmospheric conditions. Wind speed and direction help explain how air moves across an area. These are supporting inputs, not interchangeable readings. Show each pollutant and its unit separately.
Place sensors where they add useful coverage
Different streets may have different traffic patterns, building layouts and airflow. A practical deployment could include residential areas, roadside points and open spaces, with each sensor's coordinates and installation height documented. Coverage matters more than device count.
For smart city environmental monitoring, local teams should check access to power, network connectivity, physical security and opportunities to compare readings with established reference stations. Sensors placed only at convenient buildings may leave significant gaps in the resulting map.
Prepare Reliable Sensor Data for Pollution Analysis
Filter faulty readings without hiding genuine spikes
Real-time air quality monitoring depends on more than receiving frequent readings. A device might stop reporting, repeat an old value or show an abrupt change caused by contamination or a malfunction. Yet a genuine short-lived increase must not be deleted simply because it looks unusual.
Each observation should carry its sensor identifier, timestamp, location, pollutant, unit and quality indicator. Check clock differences, missing intervals, implausible values and calibration records. Some particulate sensors are affected by humidity, so their output may require appropriate correction or qualification. Retain raw readings separately from corrected values so later reviewers can understand what changed.
Create a consistent data pipeline
An IoT environmental monitoring platform can receive readings through secure gateways or supported network connections. In IoT sensor data integration, developers can align reporting intervals, standardise units and store the information as time-series records. Missing data should remain visible rather than be silently replaced with fabricated readings.
A particulate concentration measured by a local sensor is also different from an official Air Quality Index. The Indian AQI requires pollutant-specific calculations and defined data conditions. Avoid labelling estimated PM readings as official AQI.
Train AI Models to Predict Pollution Hotspots
Combine sensor history with weather and geography
An air quality prediction using AI system starts with a clear question: which pollutant concentration should be forecast, at which place and over what time horizon? Recent measurements may be combined with wind, temperature, humidity, nearby sensor readings and location characteristics. Past Diwali conditions may not repeat under different weather.
Machine learning for air quality can identify relationships within this data. However, the training set must contain representative observations, and the model must be tested on time periods it did not see during training. Overlapping training and test observations can exaggerate performance.
Distinguish future forecasting from location estimation
An air pollution forecasting model predicts how concentrations may change over time. Geographic interpolation estimates values between monitored places. Combining the two can support a future hotspot map, but they solve different problems and introduce different uncertainty.
Consider two sensors showing rising PM2.5 while nearby wind measurements indicate changing airflow. A model may forecast elevated concentrations nearby, without directly observing them or identifying their source. Where sensors are sparse, the map should avoid drawing precise street boundaries that the data cannot justify.
The model and its input processing can be built around AI-driven IoT analytics, with clear records of model version, forecast issue time, prediction horizon and confidence indicators. Validate models before retraining. A practical review can compare forecasts made before Diwali evening with measurements collected after the same time window. Separate results for busy roads and residential areas; a model that works near one sensor cluster may perform poorly elsewhere.
Convert Predictions Into Hotspot Maps and Alerts
Keep measured and predicted conditions separate
Pollution hotspot mapping works best when users can distinguish observed sensor markers from forecast areas. A map can show the latest measured concentration, when it was recorded, the forecast time and whether the underlying sensor is reporting normally. Confidence shading or clear uncertainty labels help prevent estimated concentrations from looking like exact readings.
The following inputs serve different roles in the system:
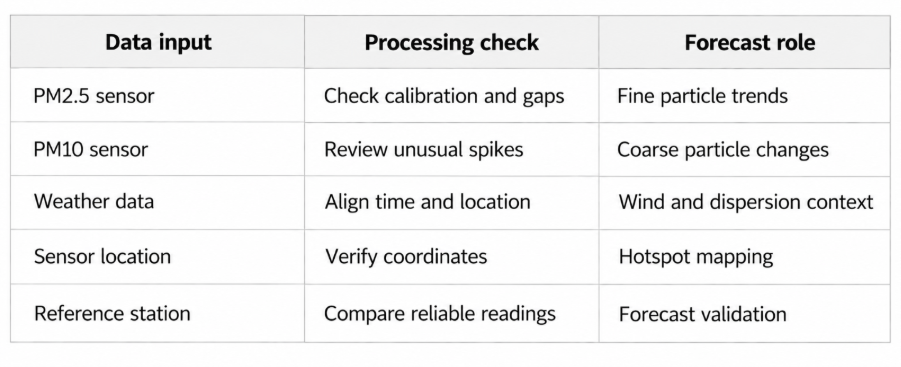
Define useful alert conditions
Location-based pollution alerts might be configured when a validated forecast suggests an elevated pollutant concentration in a monitored area. Separate technical alerts should report failed sensors or stale data. Distinguish measured, forecast and technical alerts.
The Central Pollution Control Board's National Air Quality Index report describes India's official pollutant sub-index methodology. A custom forecast dashboard should not attach official AQI labels to unvalidated sensor estimates or bypass that calculation method.
Check Forecast Accuracy as Diwali Conditions Change
Compare predictions with later measurements
A prediction system should be evaluated after the forecast period has passed. For each location and time window, compare the predicted pollutant concentration with later trustworthy observations. Examine error by sensor area and forecast horizon rather than reporting one overall accuracy figure.
A model may perform reasonably during steady conditions but struggle when wind shifts or a local sensor becomes unreliable. Preserve issued forecasts for honest evaluation. Report where the evidence is insufficient to assess performance.
Refresh forecasts when conditions change
When new measurements arrive, the system can produce updated forecasts after completing the same data-quality checks. A failed gateway, missing weather feed or sudden divergence between prediction and observation may warrant a warning before any new map is shown.
Compare results with a simple baseline, such as recent observed levels, to establish whether the predictive model actually adds value. Complexity does not guarantee better results. Teams should also test how the map behaves when a locality has no nearby working sensor.
Use Pollution Forecasts Responsibly
A smart city air quality monitoring system can help environmental teams decide where to examine trends more closely and when to communicate potential changes. Label forecasts as estimates and reference official advisories.
An elevated reading during Diwali does not establish that fireworks alone caused it. Traffic, other emissions and atmospheric conditions may also contribute. Source attribution requires additional evidence beyond particulate measurements. A monitoring application should make these limitations clear rather than turn every pollution increase into a definitive explanation.
Frequently Asked Questions
How can IoT sensors help predict pollution hotspots during Diwali?
IoT sensors provide location-specific pollution measurements that forecasting models can combine with weather and historical trends. The resulting estimates may help identify areas where concentrations could rise. Forecast quality depends on sensor coverage, calibration and validation against later observations.
Which pollutants are important for Diwali air quality monitoring?
PM2.5 and PM10 are important particulate measurements. Suitable systems may also monitor other pollutants using appropriate instruments. The selection depends on the monitoring purpose, sensor capabilities and applicable standards, while weather data provides context for changing concentrations.
How does weather affect AI-based pollution hotspot prediction?
Wind direction, wind speed, humidity and temperature can influence pollution movement or sensor readings. Including relevant weather observations helps a forecasting model account for changing conditions, although sudden local changes can still make predictions uncertain.
Can low-cost IoT air quality sensors replace government monitoring stations?
Not automatically. Lower-cost sensors can provide additional local observations, but their accuracy, calibration and operating limitations must be evaluated. They should not be presented as replacements for regulatory-grade monitoring stations or official AQI reporting without appropriate validation.
Can AI predict air pollution levels for individual neighbourhoods?
AI can estimate local concentrations where the available sensor network, weather information and validation support that level of detail. Predictions become less certain in poorly monitored areas. A responsible map communicates those limitations rather than promising exact readings for every street.
Building an AI-Based Diwali Air Quality Monitoring Platform
A useful system begins with suitable sensors and verified measurement data. It then connects weather inputs, tested forecasting models, geographic displays and clearly labelled alerts. The aim is to provide environmental teams with information they can check and act on responsibly, not to substitute estimates for official observations.
Theta Technolabs develops IoT integrations, data processing applications and AI-powered monitoring interfaces for connected solutions. To discuss a custom environmental monitoring platform, contact us at sales@thetatechnolabs.com.




















































































_How%20IoT%20Can%20Reduce%20Energy%20Costs%20in%20Smart%20Factories_Q4_25.avif)
_How%20AI%20Development%20Companies%20in%20Ahmedabad%20are%20Transforming%20the%20Shopping%20Experience_Q4_25.avif)


